|
Risk Assignments on the Gantt Chart
Risks and issues can be shown on the Gantt chart as arrows:
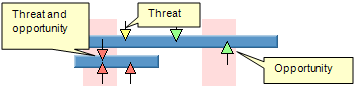
Colors represent the calculated the impact of the risk on all
project parameters combined. The size of the arrow represents
probability. You may click on each risk arrow within a Gantt chart
to be presented with information about risks:
• Only local risks are shown as arrows.
• You cannot add or remove mutually exclusive alternatives
using this dialog, but you can chance of occurrence, outcomes, and
result.
Showing or hiding risks on the Gantt chart
• Click the
 button with a standard toolbar to toggle the risk arrows on or off.
See
also
Managing
Risk Assignments
Risk
Register
|