Sensitivity Analysis
Sensitivity analysis shows which variables have the potential to
have the most affect upon the main project parameters. RiskyProject
performs calculations for the sensitivity analysis as a part all
probabilistic calculations. The results of sensitivity analysis are
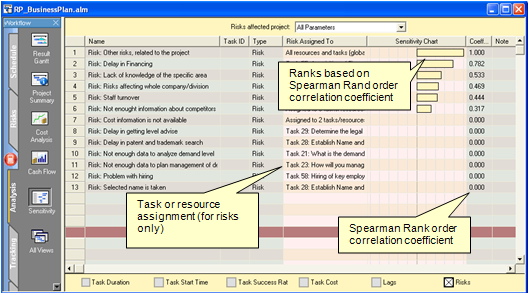
presented as a sensitivity chart in the Sensitivity View.

The Sensitivity view shows how sensitive or how much potential each
project input parameter has on the main project parameters.
Sensitivity measures how much a change in an input variable will
affect the selected project parameter. For example, if a risk
occurs, how much will it affect the project duration. This is
measured as the Spearman Rank correlation coefficient. The higher
the coefficient, the more higher potential this input parameter has
to affect the selected output parameter.
RiskyProject uses six input parameters to calculate sensitivity:
• Task duration
• Task Start Time
• Task Success Rate
• Task Cost
• Lags
• Risks
You can select these inputs using thee check boxes at the bottom of
the chart.
RiskyProject has the following output parameters:
• project duration
• cost
• finish time
• success rate
• all non-schedule risk categories
You can also select “All Parameters”. You can only measure the
affect of risks on “All Parameters” and all non-schedule risk
categories. If you select “All Parameters”, the sensitivity chart
shows the ranking across all risk categories. Using the risk
weighting entered for each risk category.
Viewing the Tornado Chart
1. Select a project parameter from the drop-down list at
the top of the chart. The name of the list changes according to the
parameter selected. If you select All Parameters, you will only be
able to see risk sensitivities.
2. Select an input parameter check box located at the bottom of the
chart. You can select more than one output parameter. The resulting
correlation coefficient is the calculated as the sensitivity of all
the selected inputs on the output parameter.
Examples:
• Input parameter Task Duration and output parameter project
Duration are selected. If task A is shown at the top of the
sensitivity chart, this indicates that the project duration is very
sensitive to the uncertainties in the task A’s duration.
• Input parameter Risks and output parameter All Parameters
are selected. If risk A is shown at the top of the sensitivity
chart, this indicates that the all risk categories (project scope,
duration, cost, all-non-schedule categories) are very sensitive to
the uncertainties caused by risk A.
• Input parameter Task Duration and output parameter project
Cost are selected. If task A is shown at the top of the chart, this
indicates that the project cost very sensitive to the uncertainties
in the task A’s duration. It occurs if task A has significant
variable cost.
• RiskyProject identifies risks based on their unique
name. For example, if the risk Budgetary Problems is assigned to
different tasks, it will be considered as one risk for the purpose
of sensitivity analysis. RiskyProject will calculate the overall
effect of this risk on the main project parameters. If you select
only risks that are input variables, you will see critical risks or
risks that have the most affect on the project schedule. In the
example above, Critical Risks start with Difficulties obtaining
comprehensive information.
• If an input parameter (task or risk) is not seen in the
list, it means that it does not have a significant effect on project
parameters.
• The correlation coefficient for a risk is not the risk
impact, it is the measure of relative importance of the risk.
Correlation coefficients are used to calculate risk impact. To read
more about this, see “How are risk probabilities, impacts, and
scores calculated?” in the Frequently Ask Question section.
See also
Crucial Tasks Chart
Success Rate Chart
Risk Chart
|
