|
Waterfall Diagrams
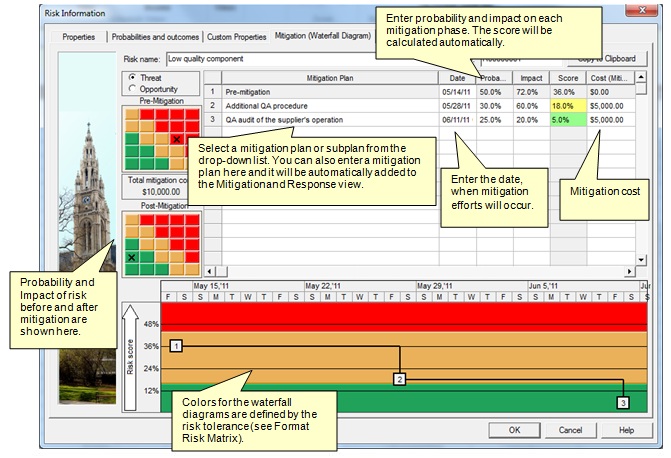
Waterfall diagrams can be used to present to mitigation efforts during different time intervals. Waterfall diagrams are defined for each particular risk. You may access waterfall diagram using Risk Register.

• Pre-mitigation probability and impact are results of calculation. Therefore they cannot be updated in the waterfall tab.
• Probability, impact, and score for the last mitigation effort will become a post-mitigation probability, impact, and score and will be presented in Risk Register.
Viewing waterfall diagrams
1. Open the Risk Register view.
2. Double click on Risk ID. The Risk Information Dialog box opens.
3. Click the Mitigation (Waterfall diagrams) tab.
See also:
Risk
Register
|
