Simulation Chart Options
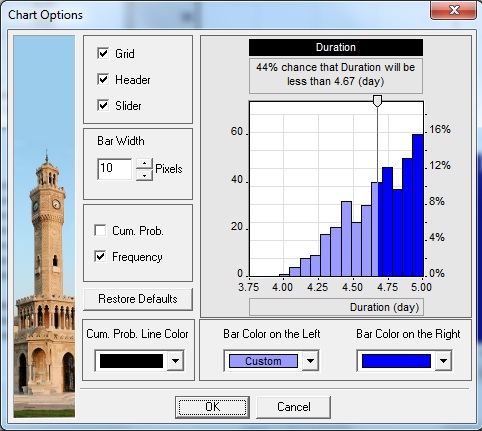
You can use the chart options to define how the charts will appear.
To define chart options:
1. Right-click on the chart. A shortcut menu opens.
2. Choose Options. The Chart Options dialog box opens.
Or
1. On the Main menu, choose Format> Format
Chart.
2. Select chart you want to format
3. Define the default viewing options.
4. The graphic on the right indicates how your changes affect the appearance of the chart.

See
also
Task Simulation Results
Task Simulation Results Cost
Enlarge Task simulation results chart
|
